Introduction
While writing code in JavaScript, you aren't required to manage any of the memory yourself. However, I've found that
developing a solid mental model of how memory works has been been crucial in my journey to try and improve as a software
engineer
There are applications where dynamic, and sometimes even garbage collected, languages may not be the best choice. This
post contains some of my experiences where I learned this the hard way.
This post will be a blend of theory and practical knowledge. I'll start by sharing some of what I've learned about
computer memory in general, then delve deeper into specifics around memory management in Node. We'll also explore ways
to debug memory leaks.
While the focus is on JavaScript and Node, the post will include some simple examples from Go as well. Comparing a
dynamic language to a static one offers a valuable contrast.
RAM
The applications we write receive a portion of our computer's working memory (RAM). We can think of this memory as a
long list of boxes. Each box has an address and can hold 8 bits:
┌─────────────────────┐ ┌─────────────────────┐ ┌─────────────────────┐ ┌─────────────────────┐
│ 01001011 │ │ 11001011 │ │ 01001111 │ │ 00001001 │
└─────────────────────┘ └─────────────────────┘ └─────────────────────┘ └─────────────────────┘
0 1 2 3
Between these boxes and the CPU sits the memory controller:
┌─────────────────────┐ ┌─────────────────────┐ ┌─────────────────────┐ ┌─────────────────────┐
│ 01001011 │ │ 11001011 │ │ 01001111 │ │ 00001001 │
└─────────────────────┘ └─────────────────────┘ └─────────────────────┘ └─────────────────────┘
0 1 2 3
▲ ▲ ▲ ▲
│ │ │ │
│ │ │ │
│ │ │ │
│ │ │ │
│ │ │ │
│ │ │ │
│ │ ┌───────────────────┐ │ │
└───────────────────────┴─│ Memory controller │─┴───────────────────────┘
└───────────────────┘
▲
│
┌───────┐
│ CPU │
└───────┘
The memory controller maintains a direct connection to each of these boxes. This allows the CPU to request any random
address from the memory controller, and receive an immediate response, hence the name random access memory (RAM).
Without this direct connection of the memory controller, we would have to scan through all the addresses sequentially to
find the data our programs are looking for
When the memory controller receives a request for an address, it retrieves the addresses of the neighboring boxes as
well. This concept is known as a cache line. Typically comprising 64 boxes, the CPU then stores these in an internal
cache. Consequently, placing frequently accessed items next to each other can enhance program speed, as they're likely
to be retrieved and cached together
In fact, many languages go even further to ensure proper memory alignment. For instance, if you create a struct in Go
that requires 7 bits, the compiler will add an extra padding bit to better align it with the underlying memory
architecture."
Memory segments
The piece of RAM allocated to our program is divided into different segments, which is going to vary depending on the
programming language. In statically compiled languages, these typically include the stack, heap, data, and text
segments.
Dynamic languages are going to have a memory layout that aligns well with their flexible needs. Given that this post is
primarily focused on JavaScript, we will concentrate on the segments most relevant to this language: the stack and heap.
The stack is a memory region where programs automatically manage data using a last-in, first-out approach. We can think
of it as having two pointers: one pointing to the base of the stack, and another to its top. When a function is invoked,
the pointer to the stack's top moves, allocating memory for all the function's local variables. Upon the function's
return, this pointer moves back to its previous position before the call.
Moving the pointer back effectively "deallocates" the memory by allowing the next function to override it. If you were
to inspect the memory just after the stack pointer had been adjusted, you would still be able to see the bits from the
previous function.
To place anything on the stack, the compiler must know how much memory to allocate. Without this information, it cannot
determine where to move the top pointer.
Let's use this Go struct as an example:
type example struct { num int64}
When we define a type like this, we're informing the compiler precisely how much memory is needed to create an instance
of it. In this case it's 8 bytes to accommodate a 64-bit integer.
Thus, if we were to create an instance of this struct within a function like this:
func someFunc() { x := example{num: 5}fmt.Println(x)
}
When this function is called, the stack pointer moves to accommodate this allocation. Once the function returns, the
stack pointer reverts to its original position. This reversion allows the previously allocated object to be overwritten
during the execution of the next function, effectively deallocating it.
In fact, Go will really try to avoid unnessecary heap allocations to such an extent that, instead of passing a reference
to the struct to the fmt.Println function, it creates a completely new instance and copies all the values over.
This might sound stupid at first. Why would we create another instance of the same struct instead of simply passing a
reference to it, as we're used to doing in JavaScript? Wouldn't passing a reference be more efficient? To understand
this, let's think of it from our programs perspective. With the stack, it's straightforward for the program to
determine when memory can be reclaimed – the memory is released as soon as the function exits
If we instead had some code like this, where the function returns the memory address for the bits of that struct (a
pointer):
func someFunc() *example { x := example{num: 5} return &x}
It's not immediately obvious when that piece of memory can be reclaimed. Another issue might arise if we want the object
to stay alive for a longer period. Perhaps it represents some long-lived state. If its placed on the stack, the next
function might overwrite it. Luckily, there's another location for storing data that may need a longer lifespan – the
heap.
While the heap offers greater flexibility, deallocating memory here is much more complex. In some languages, such as C
and C++, the responsibility to explicitly deallocate memory falls on the programmer.
However, in a large codebase, determining the exact moment when a piece of memory is no longer needed is far from
trivial. Additionally, if you deallocate the memory too soon, you risk encountering issues when the program attempts to
read or write to that memory location later.
Therefore, both Go and JavaScript use a garbage collector to handle the deallocations on the heap automatically.
We will explore the garbage collector in more detail later in the post, but in a simplified form, we can say that it
divides its work into three phases. In the first phase, the garbage collector starts with variables on the stack and
identifies which ones are pointing directly to values on the heap. Here we need to separate variables from values. A
variable x might be local to our function, but it could point to a _value_ on the heap.
During this initial phase, the garbage collector will temporarily pause all other executions. This means that our code
cannot run until this phase is complete. Once the garbage collector has identified all objects on the heap that are
directly reachable from the stack, it places them into a queue.
Next, the second phase begins, which can run concurrently with our code. This means that our code has the opportunity to
execute simultaneously, although the garbage collector will still compete with us for CPU cycles. This phase is commonly
referred to as the marking/painting phase, and it operates similarly to the previous one. The garbage collector examines
the values in the queue, marks/paints them, and then adds the values that they are pointing to to the queue. We can
think of the heap as a graph, and the garbage collector continues this process until it has marked every reachable
value.
Once that work is complete, every value that hasn't been marked is no longer reachable from any variables in our
program, and the memory for those unmarked values can safely be reclaimed."
This occurs during the third phase, during which the garbage collector once again pauses our code from running while it
deallocates the "garbage".
Now it might become clearer why Go prefers to copy things by value instead of sharing references. By keeping a value
local to a function, deallocations are simplified to just moving a pointer back and forth. This approach is typically
more performant than having to traverse a graph that could potentially contain millions of records.
So, why doesn't JavaScript do the same thing? Well, it can't. All objects, arrays, and functions in JavaScript are
dynamic. We can attach any property we'd like to them during runtime. This flexibility makes it fast to write our code.
We don't need to define the structure of our objects beforehand. However, if the compiler isn't aware of the structure,
it can't predict how much memory to allocate. And, without that knowledge, it can't determine where to move the stack
pointers. Consequently, JavaScript, along with other dynamic languages, tends to have a lot more heap allocations
compared to compiled static languages like Go or C++.
When heap allocations can become a problem
I'd say that for a large portion of applications, it's unlikely you'll encounter any problems due to this memory
allocation approach. However, there are certain scenarios where problems could arise, and when they do, they might not
be trivial to fix.
Consider this code:
const data = await someApi()const result = data.map((x) => ({ ...x, name: x.name.toUppercase() }))
The anonymous function we pass to map is allocated on the heap. Inside this function, we're spreading values into new
objects, which are also allocated on the heap. The results from this function are then placed into a new array, which,
as you might have guessed, is also going to be allocated on the heap. The garbage collector will have to clean these up
once a request is finished.
Contrast this with Go, where equivalent code wouldn't require a single heap allocation. To reclaim that memory after a
request, all that's needed is to move a stack pointer.
Now, if you benchmark a realistic Node application with numerous functions like the one described, you'll find that a
significant portion of the servers CPU time is spent on garbage collections. However, for an application with a
consistent load, this is unlikely to cause any major issues.
However, I've faced some challenging experiences when my Node applications had to handle huge bursts of incoming
request. These situations often led to problems at the worst possible times.
To illustrate, imagine we have a server that executes a lot of business logic. To respond to a single request, it needs
to make a thousand allocations on the heap. Now, if this server suddenly starts receiving a surge of traffic, the heap
will fill up quickly, triggering the garbage collector. Remember, the garbage collector pauses our code during two of
its three phases
As we wait for the garbage collector to complete its work, we're unable to handle any new requests, leading them to
accumulate in a queue. This queue may include health checks from your load balancer. If these requests don't get a
response in time, the load balancer might consider the container unhealthy, and shut it down. Consequently, the
remaining containers will have to handle an increased volume of traffic, causing their request queues to grow longer.
This can create a domino effect where they, too, might be deemed unhealthy.
The V8 engine, which Node uses, does its best to assist in such situations. It analyzes your code and identifies
opportunities to JIT compile frequently used paths. As part of this JIT compilation, it conducts what is known as escape
analysis.
Escape analysis is a process that determines whether an object can be broken up into multiple variables, thereby
avoiding a heap allocation. This optimization could significantly improve your application's performance. Consider the
following code:
function calculateSum(a, b) { const result = { sum: a + b } return result.sum}
The result object is created inside the calculateSum function and is used only to hold the sum of a and b. Since
the actual object result does not escape the function (only the value of result.sum is returned), the V8 engine can
optimize the memory allocation because it's able to identify that our function is equivalent to this:
function calculateSum(a, b) { const result = a + b return result}
Creating the object is unnessecary, and the function above can easily be converted into byte code where the numbers are
loaded directly into registers.
However, based on my experience, it's quite challenging to predict how these optimizations will unfold in less contrived
examples. I've made the mistake of relying on simple benchmarks, which suggested that Node might perform on par with
some compiled languages, and then assuming I'd see similar results in my own application. However, my application,
consisted of several thousand lines of JavaScript (excluding node modules), and wasn't JIT compiled to the same extent.
As a rule of thumb I'd say that, if Node is performing close to a compiled language, it indicates that the JIT compiler
has done an excellent job, and you're likely comparing machine code with machine code. However, if performance is
critical for the type of application you're building and you require more predictable results, I would honestly suggest
that you'd at least consider the use of another language.
However, if I/O is the primary bottleneck for you, and you aren't performing numerous transformations that excessively
fill the heap, Node can be almost as effective a choice as any other technology in terms of performance.
Now that we've established Node's propensity to utilize the heap more than some other technologies, let's dive even
deeper into that particular memory segment.
Node/V8 Heap
As I mentioned earlier, V8 is the JavaScript engine powering Node. However, V8 is also used by Google Chrome. When
executing, it adheres to the memory layout and management policies of the host process. In the context of Node, the Node
runtime oversees memory management, and V8’s allocations occur within the memory segments managed by Node.
Thus, the V8 engine gains access to the heap segments created by Node and further divides the heap into three distinct
parts.
The first two parts of the heap are known as new space and old space, designated for storing objects, strings, and
other data types. This division is made for optimization purposes.
Initially, when an object is created, it's placed in the new space segment. Being smaller, the new space facilitates
faster garbage collection runs due to having less data to scan.
In fact, the new space is actually further divided into two areas: the nursery and the intermediate. Objects are
first placed in the nursery. If they survive a garbage collection run, they move to the intermediate section, and if
they survive yet another run, they are then moved to the old space.
The old space is much larger and, depending on the machine, can grow to several gigabytes. While allocations in this
space are still fast, the garbage collection runs are much slower and occur less frequentely.
By keeping the new space small, Node can perform cleanup operations quickly. It may not be as efficient as merely moving
a pointer like the stack, but it's still fast.
This division is also important because the speed of the garbage collectors traversal isn't the only thing that can slow
down your applications; memory fragmentation can also plays a significant role.
Let's revisit our earlier analogy of RAM as a series of boxes and imagine these boxes are part of our program's heap:
┌─────────────────────┐ ┌─────────────────────┐ ┌─────────────────────┐ ┌─────────────────────┐
│ 01001011 │ │ 11001011 │ │ 01001111 │ │ 00001001 │
└─────────────────────┘ └─────────────────────┘ └─────────────────────┘ └─────────────────────┘
0 1 2 3
Now, suppose boxes 0 and 2 are cleared out by the garbage collector because they're no longer reachable from any roots:
┌─────────────────────┐ ┌─────────────────────┐ ┌─────────────────────┐ ┌─────────────────────┐
│ 00000000 │ │ 11001011 │ │ 00000000 │ │ 00001001 │
└─────────────────────┘ └─────────────────────┘ └─────────────────────┘ └─────────────────────┘
0 1 2 3
This creates a problem: we can no longer allocate two contiguous bytes. Remember, we prefer not to spread data too
widely, as having related values in close proximity speeds up our programs. This is because the CPU fetches everything
it needs in one go when it retrieves a cache line.
Thus, it's a clever strategy that the V8 engine only moves long-lived objects to the larger old space. If this space
were shared with many short-lived objects, it would necessitate much more frequent reshuffling of data, which would
result in worse performance.
Now that we've covered the first two divisions that the V8 engine makes of the heap space, let's discuss the third,
known as code space.
The code space portion, is used to store the generated machine code. Other languages that compile to a binary, does not
store the machine code on the heap. Instead, it gets stored in the text segment. However, since the machine code in Node
is generated by JIT complilation at runtime, it makes the amount of memory needed unpredictable. It may need to grow or
be discarded if the engine decides to deoptimize a function. Therefore, the V8 engine will reserve a part of the heap
for the compiled byte code.
Memory leaks
Up until now, we've delved into a lot of memory theory. I'd like to shift our focus to something more practical, and
share my experiences with identifying and resolving memory leaks.
A memory leak occurs when an object on the heap remains accessible through some unintended reference. Since heap
deallocations are automated, the objects will persist as long as the garbage collector is able to reach them during the
traversal.
I've encountered memory leaks of varying complexity. Some were straightforward to detect and fix, while others were very
difficult. Next, I'll share some practical tips and tricks that I've found useful.
The easiest issues to fix are the ones when you're able to quickly reproduce a Allocation failed - JavaScript heap out
of memory error.
The simplest issues to resolve are those where you can quickly reproduce an Allocation failed - JavaScript heap out of
memory error.
However, in my experience, the it's rarely the case that the errors are that easy to reproduce. I've dealt with leaks
that occurred gradually. For instance, there was a case where a reference was inadvertently retained due to the error
handling of specific HTTP codes. The server would take several days to crash, often with new deployments occurring well
before any signs of trouble.
So, if the server never crashes, how do you recognize a leak? The most obvious method is to monitor your applications
memory metrics. Another indicator is a gradual degradation in performance. As the old space expands, the V8 engine is
going to trigger slower, more resource-intensive garbage collector runs. The runs will be triggered more frequently, and
consume more and more CPU cycles which is going to impact your applications performance.
The most effective way to confirm a slow brewing memory issue like this is to run your application locally with the
--trace-gc flag. By continuously sending realistic requests to your local server, you can generate logs that look like
this
[42662:0x128008000] 38 ms: Scavenge 6.2 (6.3) -> 5.5 (7.3) MB, 0.25 / 0.00 ms (average mu = 1.000, current mu = 1.000) allocation failure;
There is a lot of information in this single line of text, so let's dissect it piece by piece.
38ms is how long it took for the garbage collector to run. 6.2 is the amount of heap space used before the garbage
collector run in MB. (6.3) is the total amount of heap used before the run. 5.5 is the amount of heap used after
the run, and (7.3) is the total amount of heap used after the run.
0.25 / 0.00 ms (average mu = 1.000, current mu = 1.000) is the time spent in GC in milliseconds, and allocation
failure is the reason for running the GC. The term allocation failure as the reason for running the GC may sound
alarming, but it simply means that V8 has allocated a significant amount of memory in the new space, triggering a
garbage collection run to either deallocate some objects or promote them to the old space.
You can find the actual print statement in V8s source code
I've saved an important detail for last: the term Scavenge. Scavenge refers to the algorithm that performs garbage
collection runs in the new space.
It's beneficial to us that the algorithms name is explicitly printed in these logs, because we're going to ignore all
Scavenges since they trigger frequentely, and instead focus on the Mark-sweep runs, which are garbage collection
processes occurring in the old space.
In fact, before encountering the dreaded Allocation failed - JavaScript heap out of memory error, you'll typically see
a log entry stating <--- Last few GCs --->, followed by several Mark-sweep statements. This indicates the V8 was
desperatly trying to free up some memory before it crashed.
The Mark-sweep algorithm, as we've discussed, involves two phases. The first phase marks objects so the garbage
collector knows which ones to delete. The second phase, sweep, deallocates memory based on those markings
Between these two phases, there's another important step. After the marking is complete, the garbage collector
identifies contiguous gaps left by unreachable objects and adds them to a free-list.
These free-lists are going to improve the performance for future allocations. You see, when the V8 needs to allocate
memory, it consults these lists to find an appropriately sized chunk, eliminating the need to scan the entire heap. This
approach helps to significantly reduce memory fragmentation. In fact, the garbage collector will only move objects
around (a process known as compaction) if the memory pages are highly fragmented. From my experience, it's quite rare to
see these log statements that indicates that compaction from Node's garbage collector took place.
Seeing Mark-sweep statements in your logs is normal and shouldn’t be a cause for immediate concern. You should only
start to worry if you notice that the intervals between these statements are getting shorter, while the time spent on
garbage collection is increasing. Clearly, this is a horrible combination for your applications performance: garbage
collection runs become more frequent and take longer.
Suppose you've now been able to confirm the presence of a memory leak. How should you go about locating the problematic
code? My approach varies depending on how slow the leak is.
If it's noticeable fairly quickly, I typically launch the application with a reduced old space size by setting
--max-old-space-size to a low value. This adjustment makes the application crash faster. In conjunction with this, I
use the --heapsnapshot-near-heap-limit=1 flag to capture a snapshot of the heap just before it crashes.
We can then use the developer tools in Google Chrome to load and inspect the snapshot:
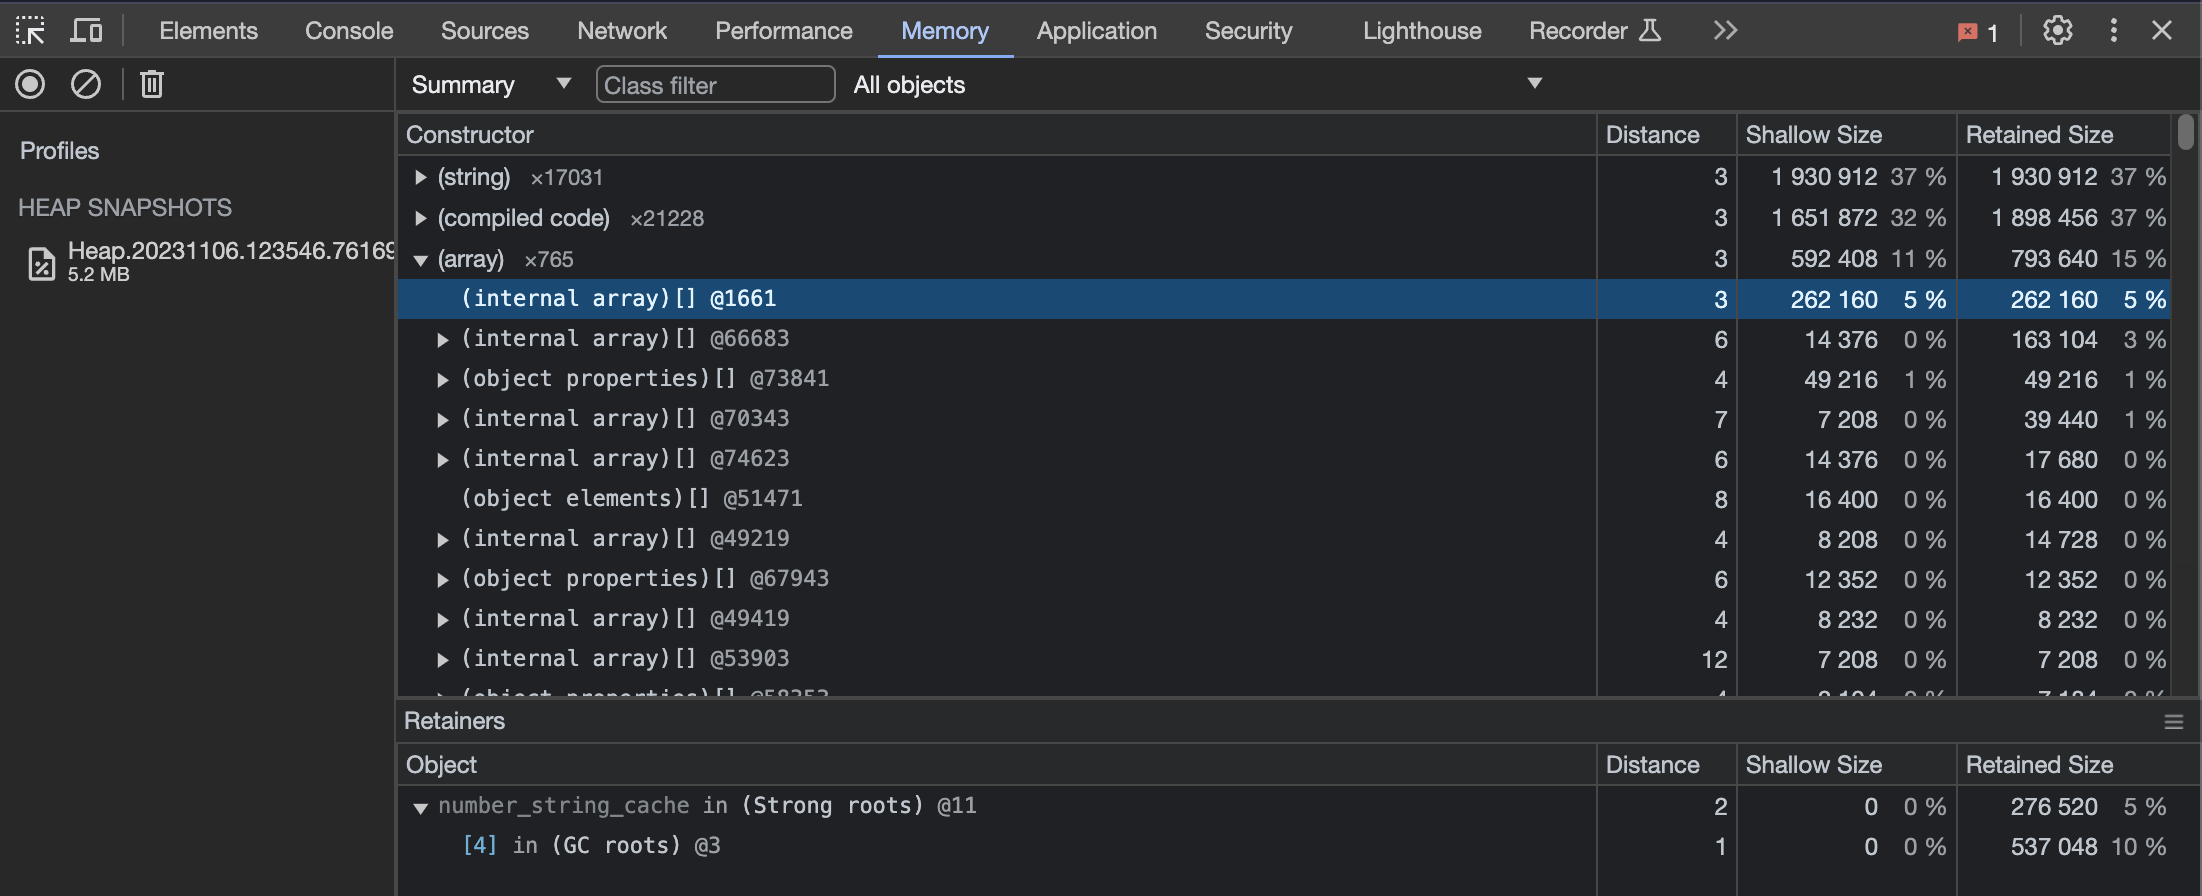
If the memory leak is so gradual that significantly reducing the old space size is required to force a crash,
pinpointing the actual issue can be challenging. In such cases, the app might crash from normal usage, and the leaking
allocations might not even have occurred yet.
In this scenario, I might leave my computer running overnight with only a moderate reduction in heap size. If it
crashes, I can analyze the snapshot in the morning, looking for either one exceptionally large object or numerous small
ones cumulatively exceeding the allocated memory.
If this approach doesn’t yield results, or if I fail to reproduce the issue locally, I might add a temporary endpoint to
my server. This endpoint, accessible only within my applications VPC and with proper authentication, triggers some code
that takes a snapshot of the servers heap, and uploads it some storage like S3. I might take a few of these snapshots
over a couple of days before I try to analyze them.
I then, once again, load these snapshots into Chrome and choose the comparison option like this:
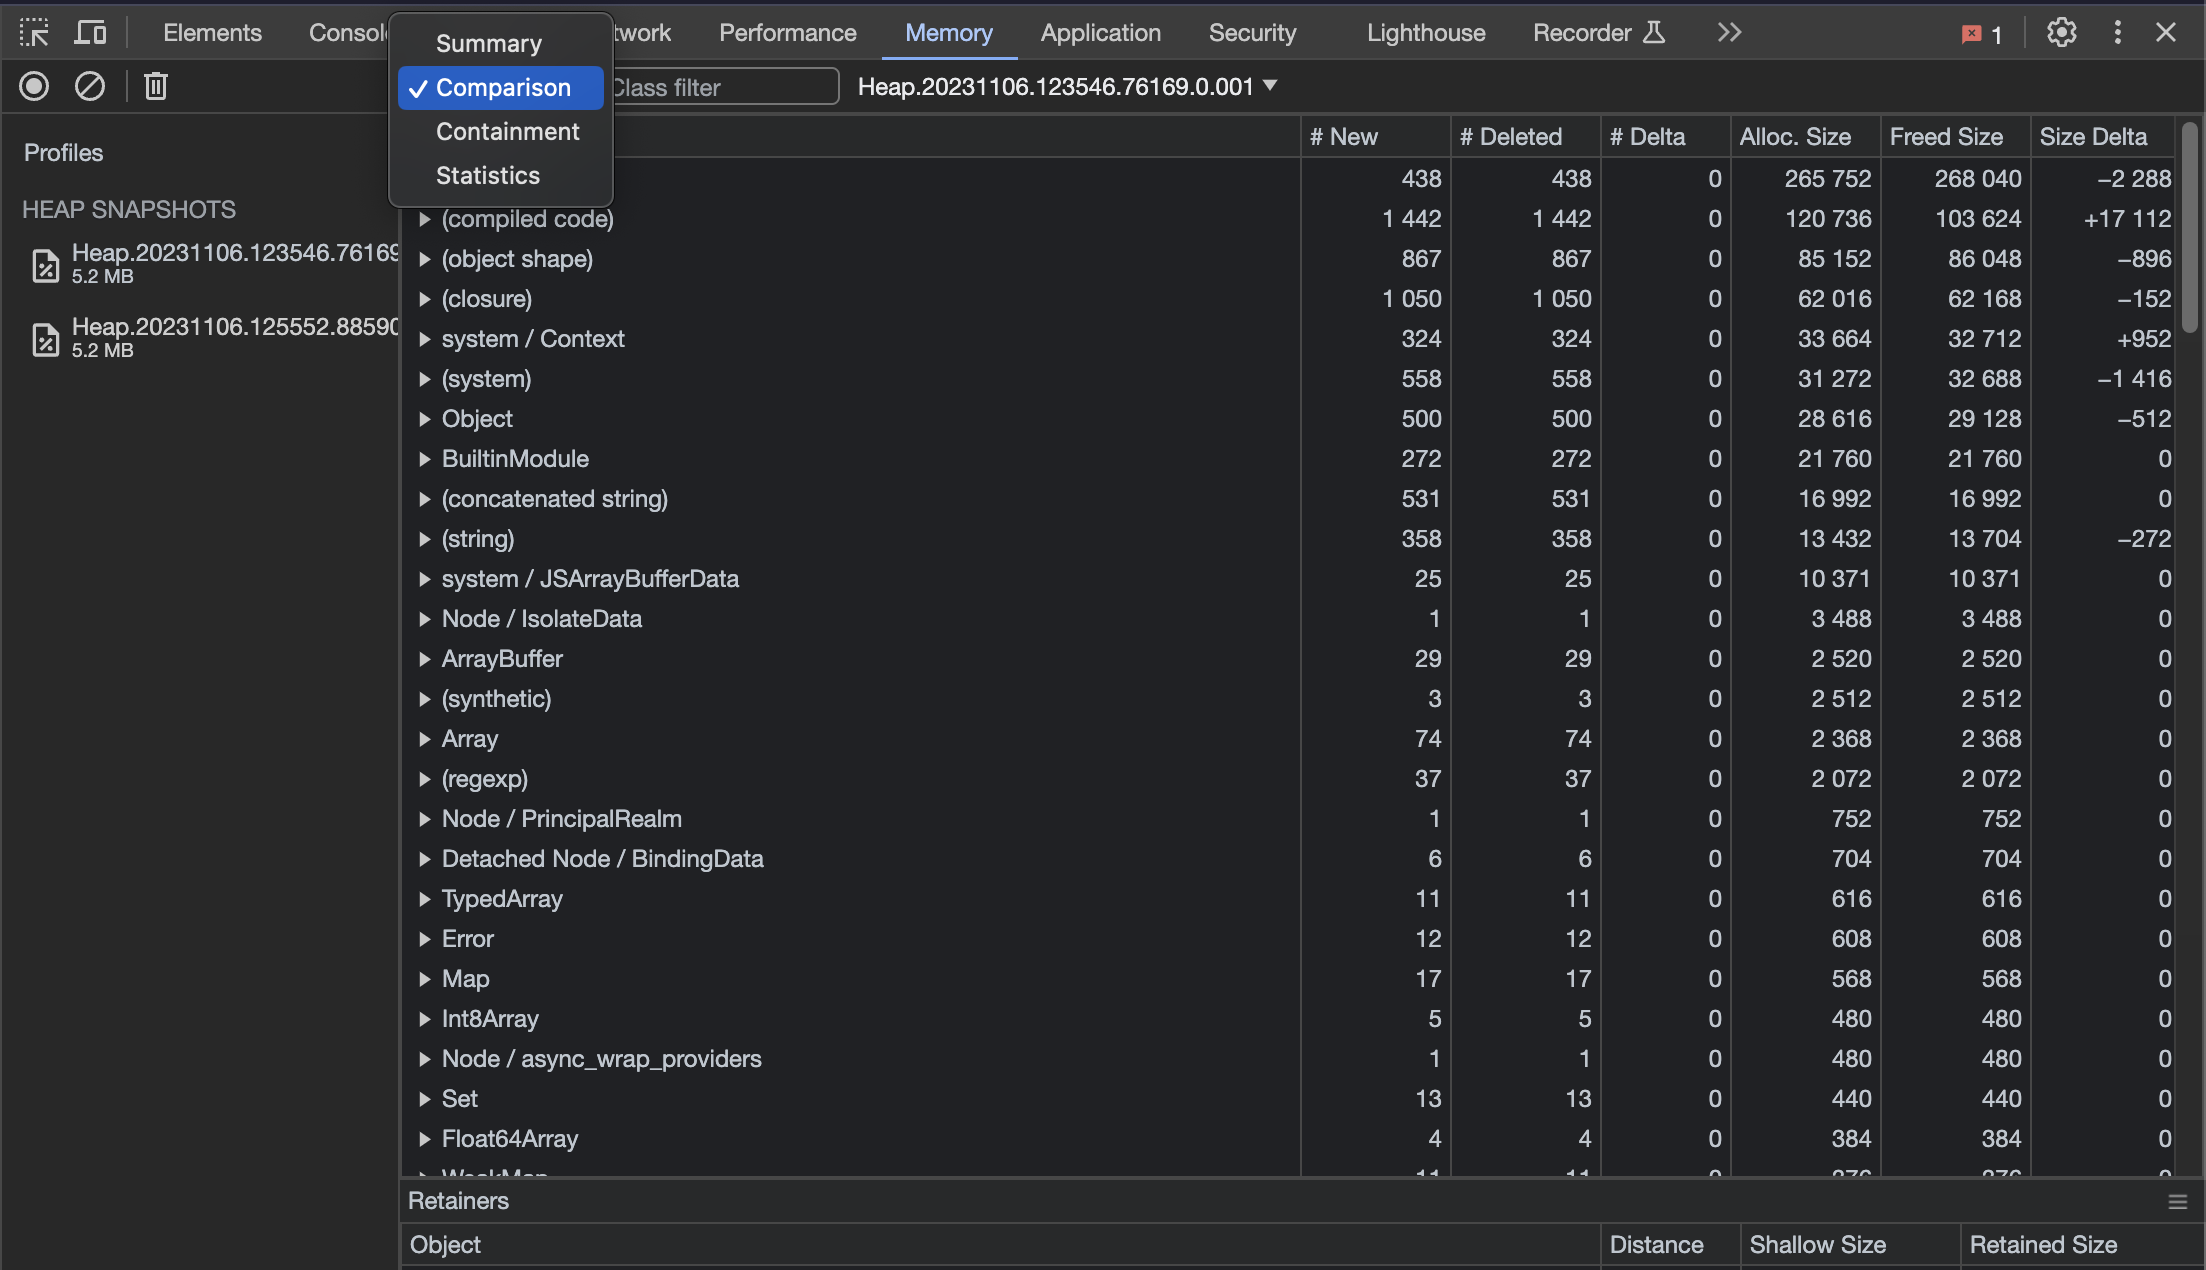
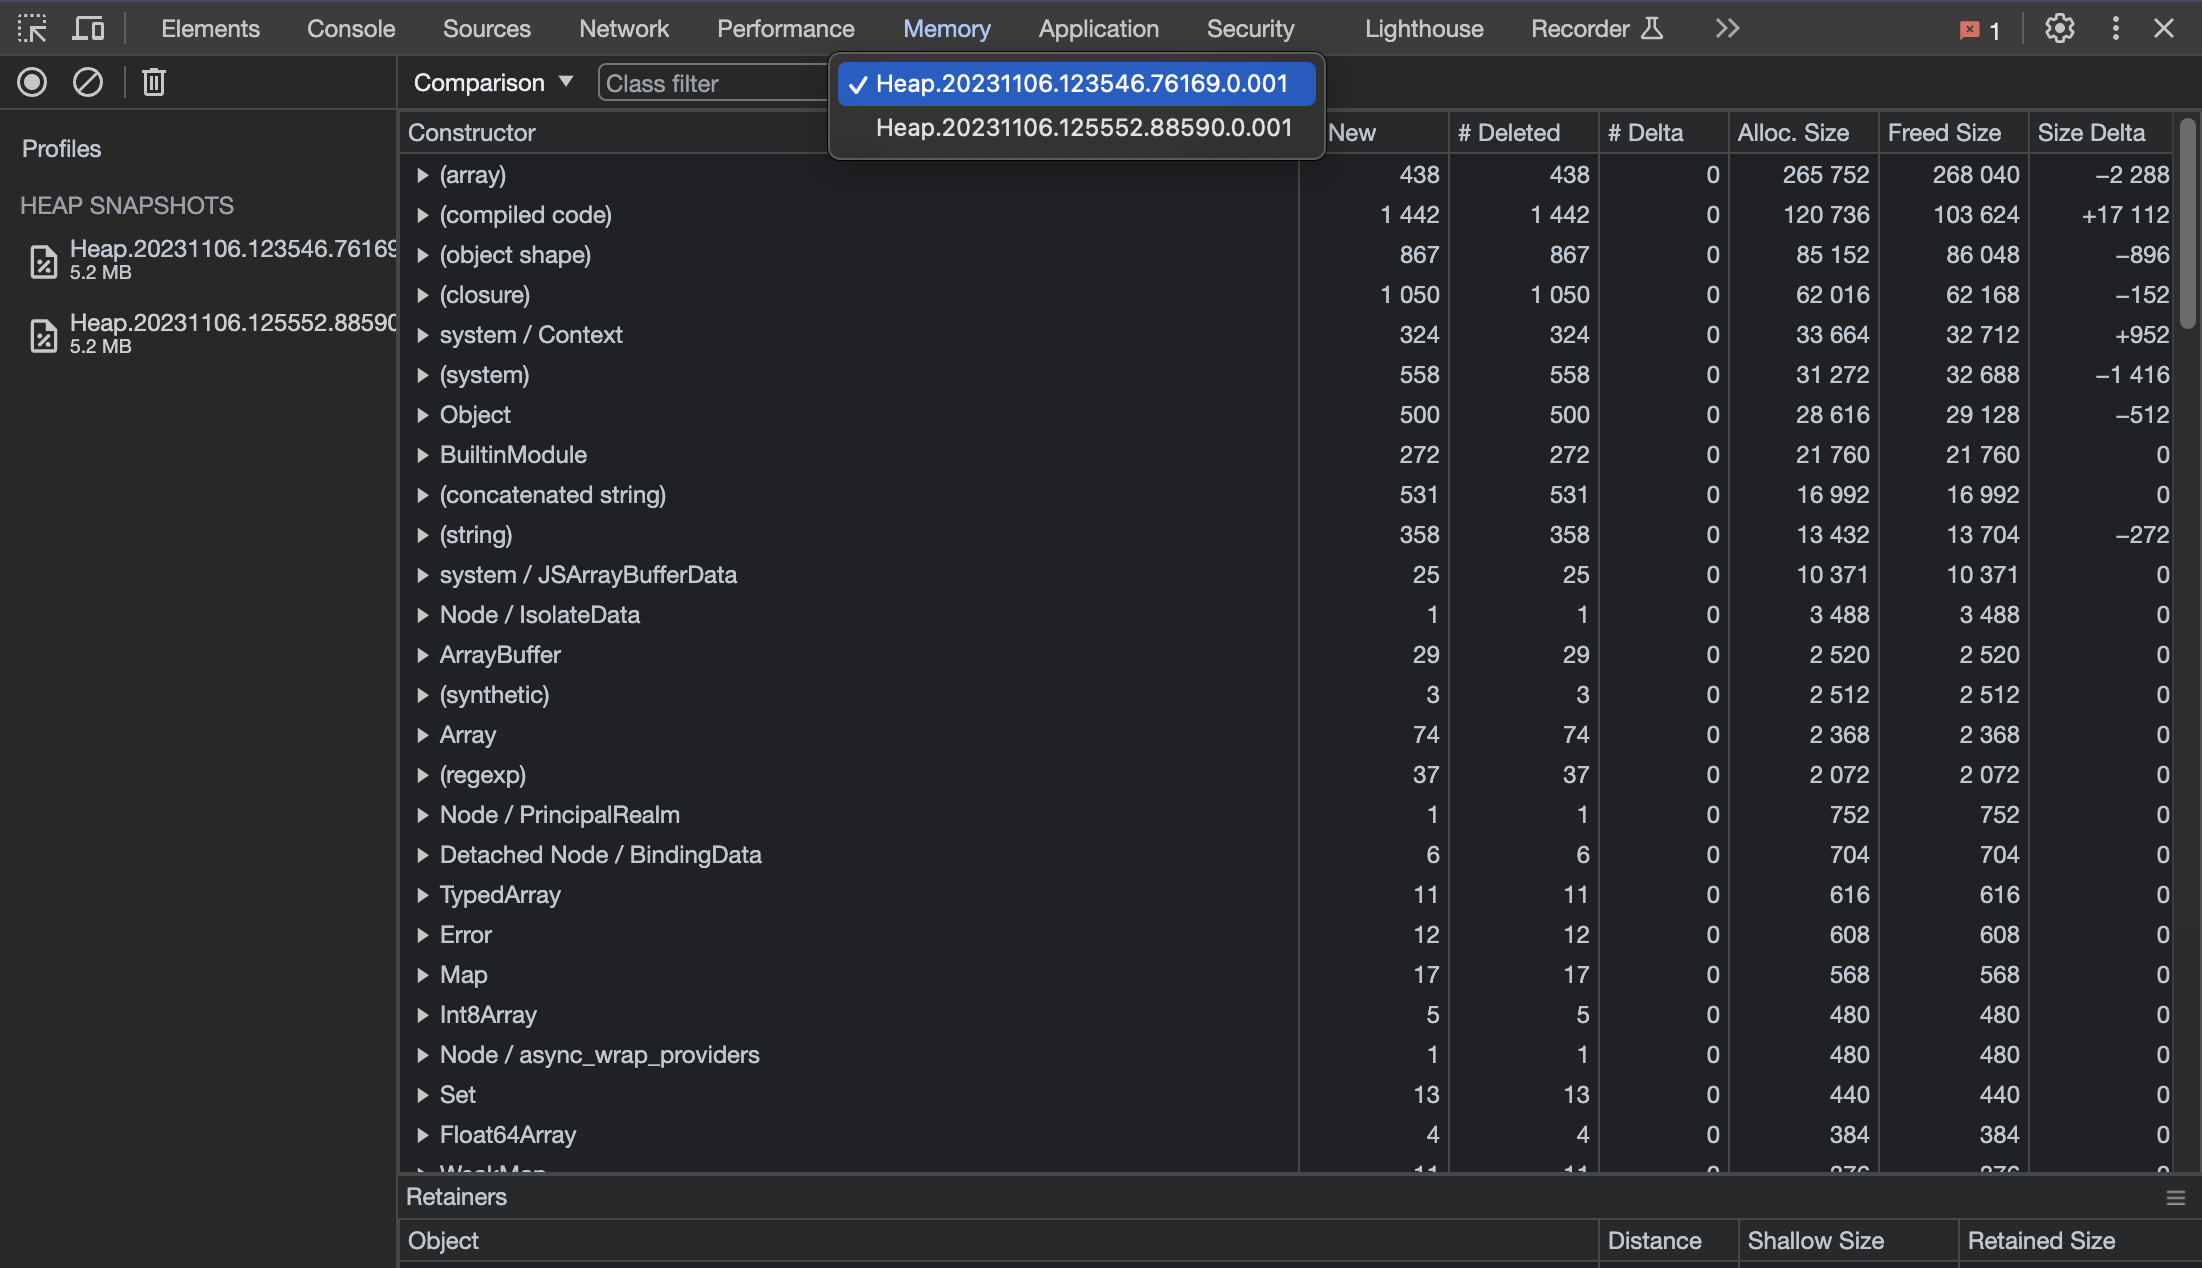
This allows you to see how the heap has changed between different snapshots.
The next things I like to do is to sort based on Size Delta:
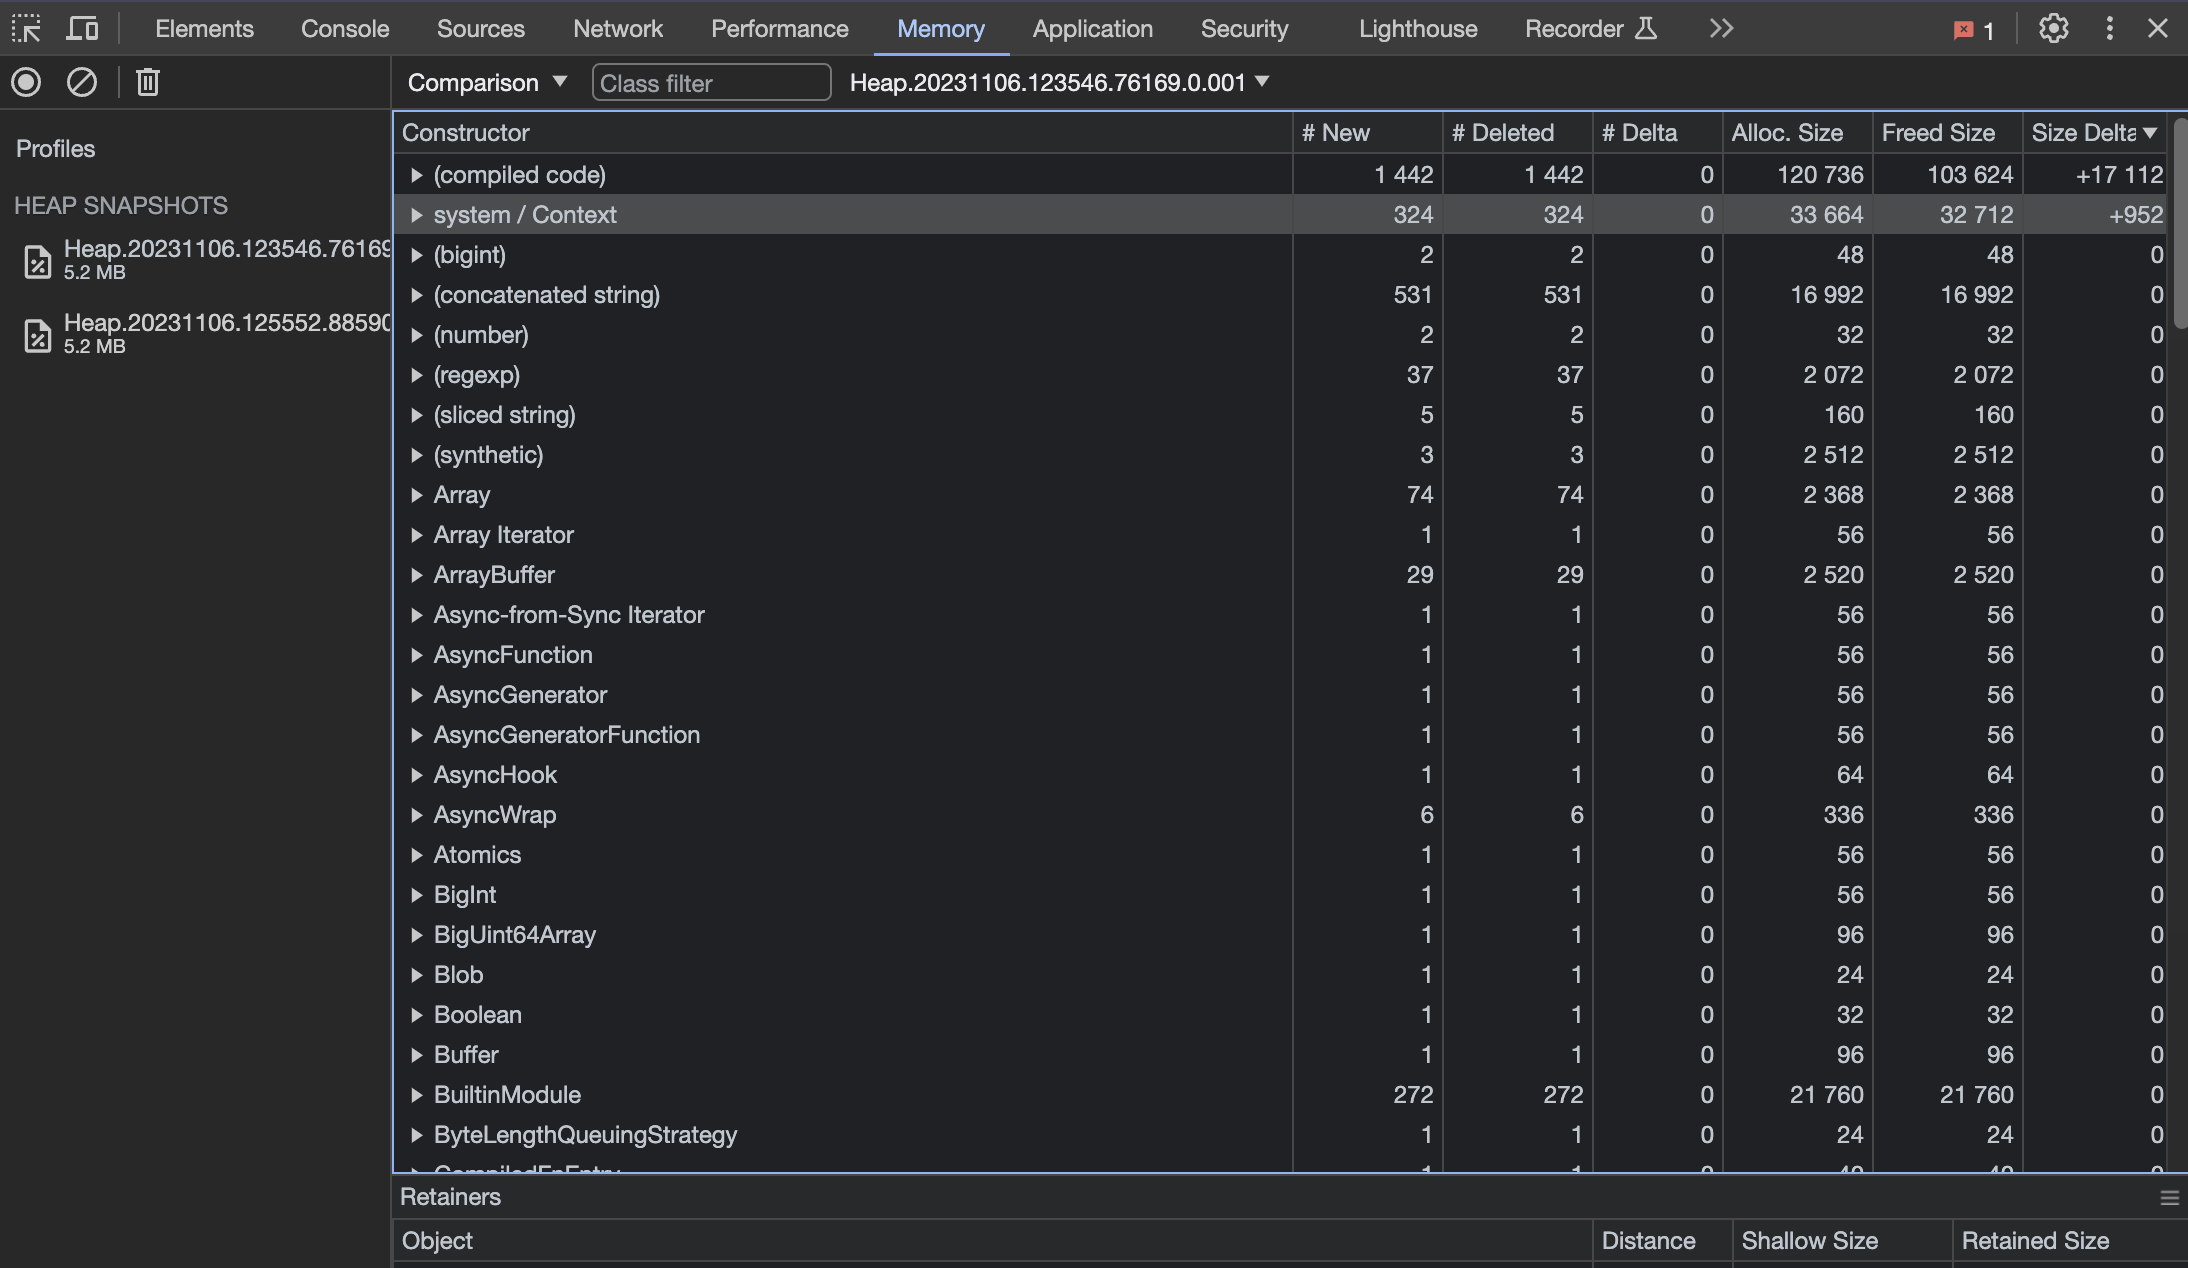
This is, of course, a contrived example, but should this code have contained a memory leak, we would expect to see an
increasing delta over time.
This brings us to the end of this post. I hope you have found the information useful!
The end
I usually tweet something when I've finished writing a new post. You can find me on Twitter
by clicking